Serial Port Software Oscilloscope

Serial Port Software Oscilloscope

I'm excited to introduce SerialTool's innovative software oscilloscope, a powerful utility designed to transform the way we monitor and analyze serial port communications. This tool is engineered to provide real-time insights into data traffic, offering a level of granularity and control that is indispensable for debugging, performance analysis, and ensuring the integrity of serial communications.

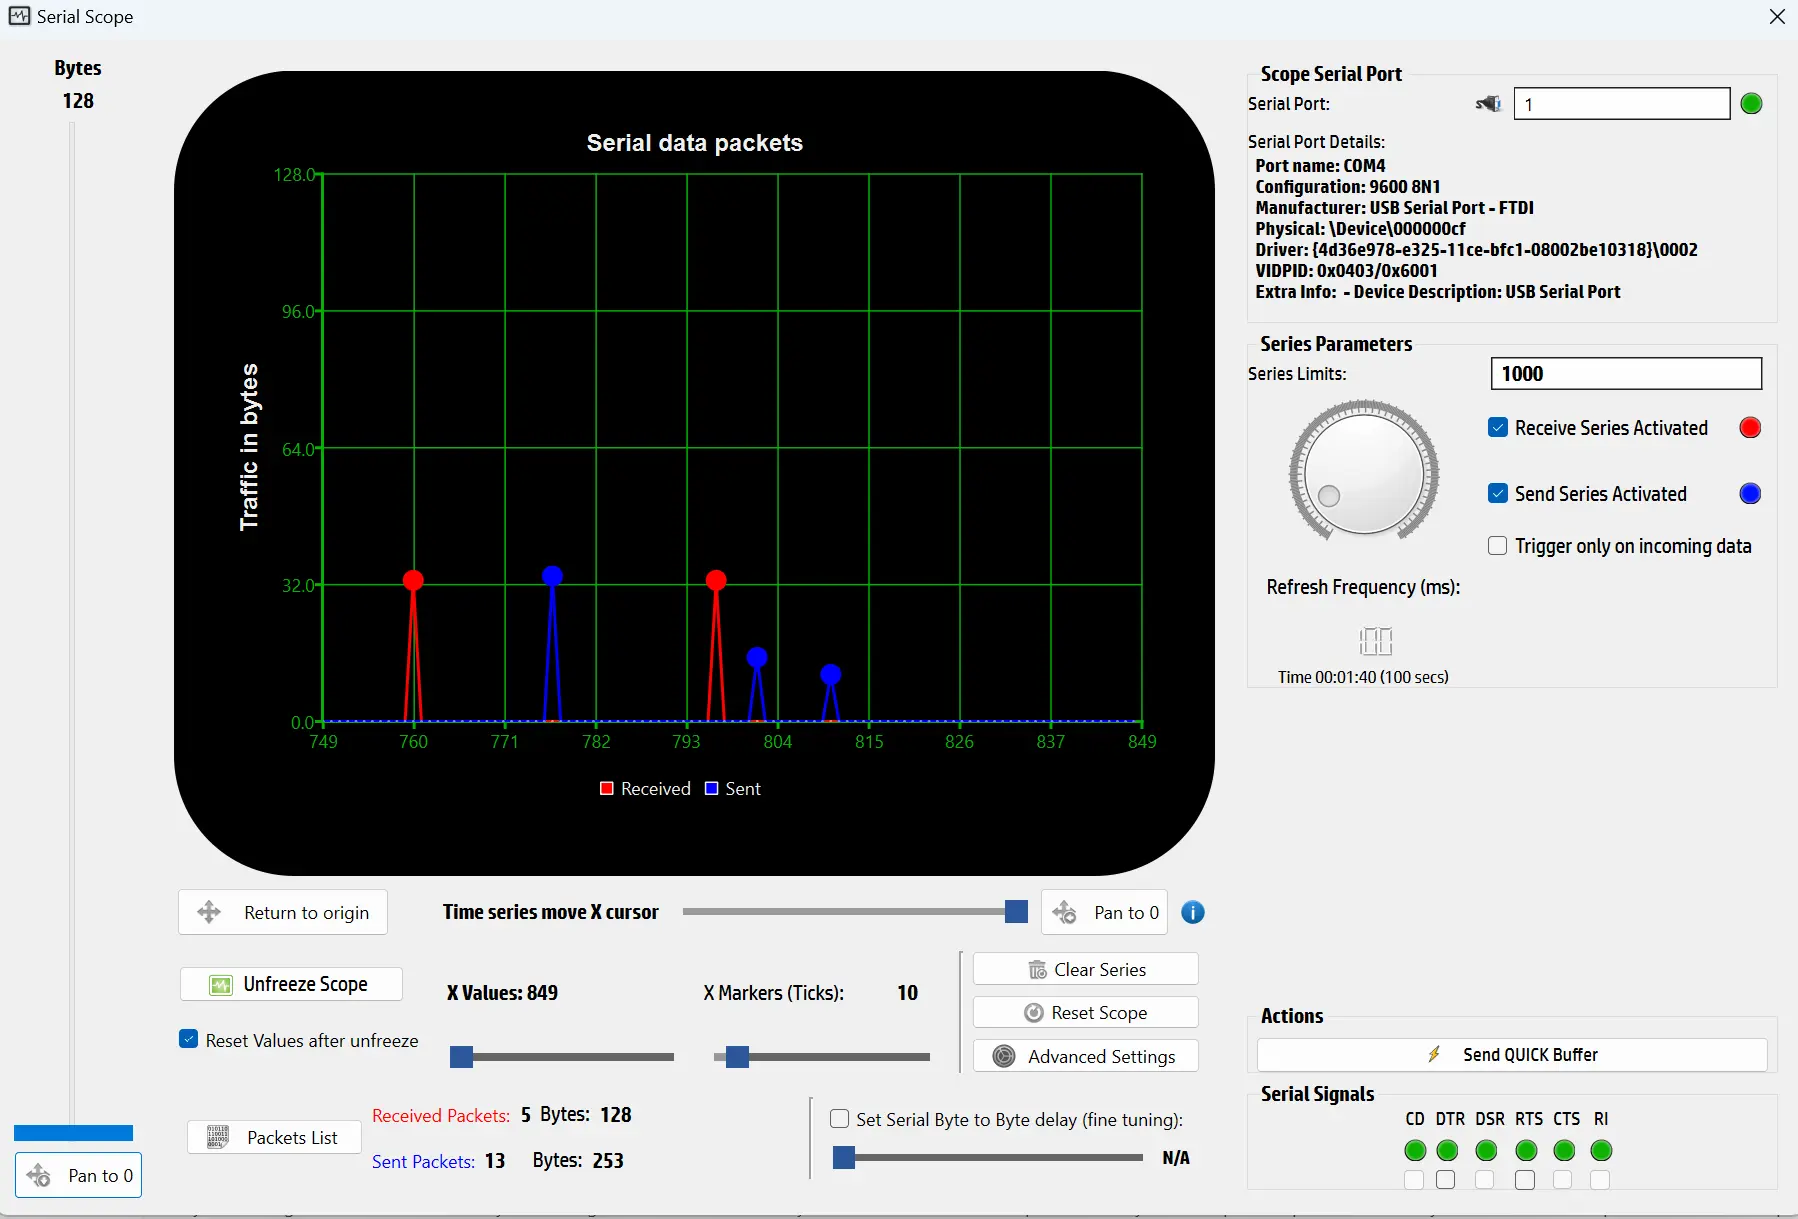
The main screen of our SerialPort Software oscilloscope presents a comprehensive interface tailored for detailed examination of serial data packets. At the core of this interface is the oscilloscope graph, which visually represents the traffic in bytes for both sent and received data packets over time. The Y-axis displays traffic volume in bytes, while the X-axis denotes the time series, segmented into ticks. Each packet is depicted with markers—red for received data and blue for sent data—forming pairs that illustrate the sequence of data exchanges between devices. This visual pairing helps users understand the flow and volume of data, making it easier to identify patterns and potential issues.

Official documentation about Serial Port Oscilloscope function is available here.


SerialTool Sperial Port Oscilloscope Main View


The screenshot captures the main screen of the SerialTool's SerialPort Software oscilloscope interface, which is an advanced tool designed for real-time monitoring and analysis of serial data packets. This tool provides a comprehensive view of data traffic, aiding in troubleshooting and performance assessment of serial communications.

At the heart of the interface is the oscilloscope graph, which visualizes the traffic in bytes for both sent and received data packets over time. The Y-axis indicates the traffic volume in bytes, while the X-axis represents the time series, segmented into ticks. Red markers denote received data packets, and blue markers indicate sent data packets. These markers are displayed in pairs, illustrating the sequence and relationship of data exchanges between connected devices via the serial port. This visualization aids users in understanding data flow, detecting anomalies, and analyzing communication efficiency.

Adjacent to the graph on the right, detailed serial port information is provided. This includes the port name (COM4), configuration settings (9600 8N1), manufacturer details (USB Serial Port – FTDI), and driver information. Users have control over the activation of data series for both receiving and sending, which can be toggled via checkboxes. The interface also allows for the customization of series limits and the refresh frequency of the data display, providing users with the flexibility to monitor data according to their specific needs.

A range of control options is available beneath the graph. Users can unfreeze the scope to resume real-time monitoring, reset values upon unfreezing, and manipulate the X-axis cursor to pan through the time series data. The zooming function is a crucial feature, allowing users to zoom in on specific segments of the data timeline for a closer inspection of traffic patterns and packet details. This functionality enhances the ability to perform detailed analyses and identify issues with precision.

Real-time statistics are summarized at the bottom of the interface, displaying the number of sent and received packets along with their total byte counts. The current display shows 5 received packets totaling 128 bytes and 13 sent packets totaling 253 bytes. This summary provides an immediate overview of the data communication volume.

For more advanced data manipulation, users can clear the series data, reset the scope, and access advanced settings to fine-tune the oscilloscope's operation. An option to send a quick buffer is available for immediate data transmission.


SerialTool Sperial Port Oscilloscope Signals


Here you cna see a section of the SerialTool interface, specifically focusing on the “Actions” and “Serial Signals” areas. This portion of the interface enhances user control over serial communications, offering both quick actions and detailed signal management capabilities.

In the “Actions” section, the prominent feature is the “Send QUICK Buffer” button. This functionality allows users to rapidly transmit a predefined buffer of data present in the QUICK Buffer on the main SerialTool page, streamlining the process of sending test data without switching between windows. This feature is particularly useful for testing and debugging, as it provides a quick and efficient way to send data packets.

Below the “Actions” section, the “Serial Signals” area displays the status of various control lines associated with the serial port. The indicators for CD (Carrier Detect), DTR (Data Terminal Ready), DSR (Data Set Ready), RTS (Request to Send), CTS (Clear to Send), and RI (Ring Indicator) are shown as green circles, indicating that all signals are currently active. The interface also includes checkboxes for each signal, allowing users to change the signal statuses. This capability is crucial for managing the physical layer of serial communication, enabling users to simulate different conditions and troubleshoot connectivity issues effectively.


SerialTool Serial Port Oscilloscope Series Parameter


Here you can see the “Series Parameters” section of SerialTool, a key area that allows users to manage how data packets are captured and displayed in real-time. In SerialTool, a “series” refers to the continuous collection of data packets over time, with two main types: “Receive Series” and “Send Series.” These series are essential for visualizing incoming and outgoing data packets, represented by red and blue markers, respectively, on the oscilloscope graph.

Users can set the limit for the number of data pairs to be captured in a series, choosing from predefined options such as 1,000, 10,000, or 100,000. This flexibility helps accommodate varying volumes of data traffic. Once the specified number of pairs is reached, the current series is automatically cleared, and a new series begins. This means the series data is not stored in a FIFO (First In, First Out) manner but rather reset to ensure continuous monitoring without data overflow.

Activation of the data series is straightforward. Users can enable or disable the capturing of both receive and send series through checkboxes. This section also features an option to trigger data capturing only when incoming data is detected, providing a more focused monitoring capability.

The refresh frequency of the data display can be adjusted, ensuring the graph updates at intervals that match the user's needs. This parameter allows for real-time data visualization, crucial for precise monitoring and analysis. The timer at the bottom of this section shows the elapsed monitoring time, offering a reference for tracking the duration of the data capture session.

In essence, the “Series Parameters” section is designed to provide robust control over the data monitoring process. By setting series limits, activating the necessary data streams, and adjusting the refresh rate, users can tailor the tool to their specific requirements, ensuring efficient and effective serial communication analysis.

Serial Port Oscilloscope – Packet List and Details

SerialTool Sperial Port Oscilloscope Packets List


By pressing the  “Packet List” button located on the main screen of the SerialTool Oscilloscope window a “Packets List” view shows up on the right side of from the SerialTool Oscilloscope interface.

In the “Packets List” view, you can see a detailed log of all sent and received data packets. Each entry in the list provides comprehensive information about individual packets, including:

  • A timestamp indicating when the packet was recorded.
  • A unique packet identifier.
  • The size of the packet in bytes.
  • A preview of the data content within the packet, displayed in hexadecimal format.

The entries are color-coded, with red icons representing received packets and blue icons representing sent packets. This visual distinction helps users quickly identify the direction of each data packet.

At the bottom of the list, there are options to customize how the packet data is displayed:

  • “Add packets to the bottom”: When enabled, new packets are added to the bottom of the list rather than the top.
  • “Show preview in ASCII”: When checked, this option allows users to view the data content in ASCII format instead of hexadecimal.

This detailed log of packets provides users with a thorough overview of all data communications, making it easier to analyze and troubleshoot serial port interactions. The ability to view both sent and received packets in a single list enhances the efficiency of data analysis and helps identify any discrepancies or issues in the data flow.

 
SerialTool Sperial Port Oscilloscope Packets View


I’m pleased to highlight the detailed packet analysis capabilities of SerialTool, demonstrated in this screenshot of the “Packet Information” window. This window appears when you double-click on any entry within the packet list from the main screen of the SerialTool Oscilloscope interface. This feature provides in-depth insights into the specific data packet you are examining, significantly aiding in the debugging and analysis process.

Upon accessing this detailed view, the interface is divided into several informative sections. On the left, the “Serial Port” details are displayed, including information such as the port name, configuration, manufacturer, and driver specifics. This context is crucial for understanding the environment in which the data packet was captured.

On the right side, you find detailed “Packet” information. This includes the timestamp of the packet, its unique ID, the length of the packet in bytes, and the exact data content. It also provides contextual information about adjacent packets, showing the IDs and lengths of the previous and next packets along with the time differences between their captures. This helps in understanding the sequence and timing of the data flow.

At the bottom of the interface, the packet's hexadecimal representation is displayed, alongside its ASCII interpretation. This dual representation allows for a thorough examination of the packet's contents, making it easier to diagnose issues at both the byte and character levels.

Additionally, a search function enables users to look for specific data within the packet, either in ASCII or HEX format, with an option for case-sensitive searches. This is particularly useful for pinpointing exact sequences of interest within the packet data.

The navigation controls allow you to move through the packet list, jumping to previous or next packets, or even starting from the beginning to get a sequential overview. You can also copy the packet details to the clipboard or export the data to a binary file for further analysis or record-keeping.

This detailed packet view transforms SerialTool into a powerful utility for anyone working with serial communications, offering the depth of analysis required to ensure data integrity and troubleshoot communication issues effectively.